What is an intuitive dashboard?
Are you struggling with systems that don’t talk? Do you have lots of data, but not in real-time? Too many pivot tables and spreadsheets? These are all areas where Intuitive Dashboards can help you and your organisation.
Intuitive Dashboards are the next generation of advanced Business Intelligence (BI) software enabling you to create your own interactive and graphical dashboard view of critical business data. All are based on the KPIs that matter most to you. Intuitive Dashboards are easy-to-use and highly configurable.
Access to live data dashboards removes the time-consuming and manual process of creating reports that may only sometimes be up to date. With live access to the data, you are much more likely to be able to find unexpected insights.
Using dashboards ensures that the correct data is available to the right people with minimal effort, freeing people up to make the most of the strategic aspects of the role.
OUR DASHBOARD BUSINESS INTELLIGENCE TOOLS ADDRESS THE COMMON CHALLENGES BUSINESSES FREQUENTLY COME UP AGAINST:
- Information having a ‘one size fits all’ approach delivering limited value
- Data behind reports is rarely accessible, making it impossible to ask questions or change the way data is presented
- Users have access to a wealth of information, but, in most cases, the right people are not given the correct data at the right time to be able to support effective decision making
Whilst our dashboard tools apply to various data sources at any level of organisation, we also have standardised reporting tools available for specific areas leveraging our experience.

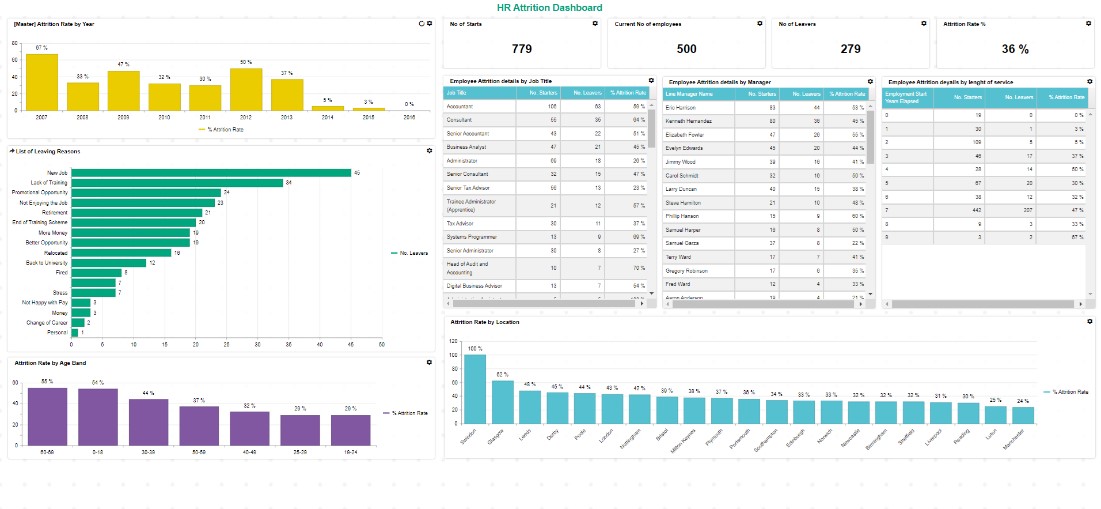
How can it help my HR organisation?
The cost of replacing staff can be up to four times their annual salary. Therefore, organisations must ensure they effectively recruit, manage, and retain their employees. Employment is most businesses’ most significant asset and overhead, and managing staff effectively can increase competitive advantage and profitability.
Our HR dashboard tools allow you to improve your stakeholders’ services whilst reducing the cost and effort of producing traditional HR reporting. The dashboards provide individual users and departments with personalised, relevant information they can digest and act upon.

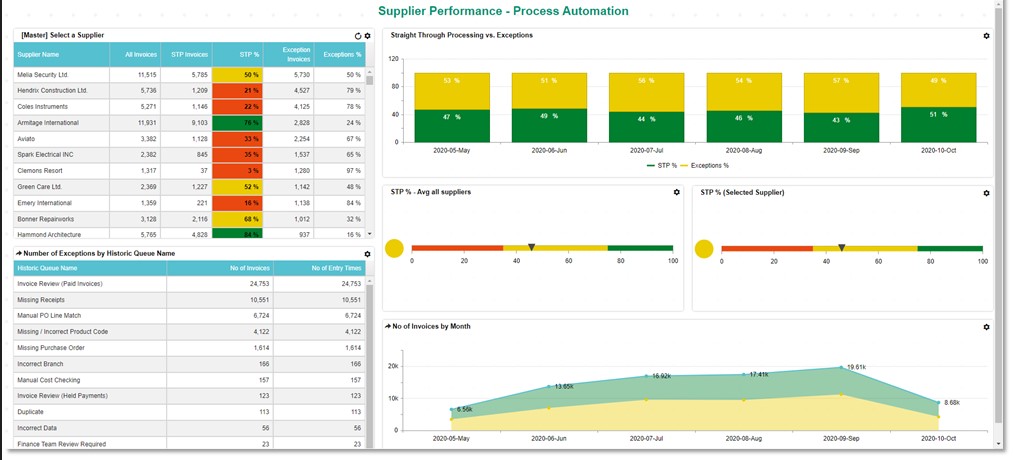
HOW CAN IT HELP MY ACCOUNTS PAYABLE ORGANISATION?
Practical dashboarding tools optimise your Accounts Payable process and allow you to spot issues early. Dashboards highlight process bottlenecks and will enable you to act swiftly.
Dashboards for Accounts Payable will deliver you the following key benefits:
- Early payment discounts with individual suppliers.
- Ensure that you comply with government legislation on supplier payments and don’t miss deadlines.
- Filtered data allowing performance of individual suppliers can be viewed so collaboration can take place to improve performance.
- Dashboards allow you to automate the AP reporting process to different users and departments, all without having to run individual reports each time and showing live data.
Our dashboard reporting tools for Accounts Payable uses pre-published data models, designed to give you the metrics you need straight away; without hours of effort required to build them from a basic toolset.
The dashboards can be further customised to the individual needs of different areas of the business to provide additional user satisfaction and adoption.

Discover all areas of the digital journey, with our Guide to Going Digital
Our experts guide you through how going digital can deliver you exciting business solutions in every department and at every level.
6 KEY AREAS OF FOCUS:
- Effectiveness & efficiency
- Digital compliance & GDPR
- Remote working
- Customer & supplier engagement
- Staff retention
- Cost saving
